Data
Contents
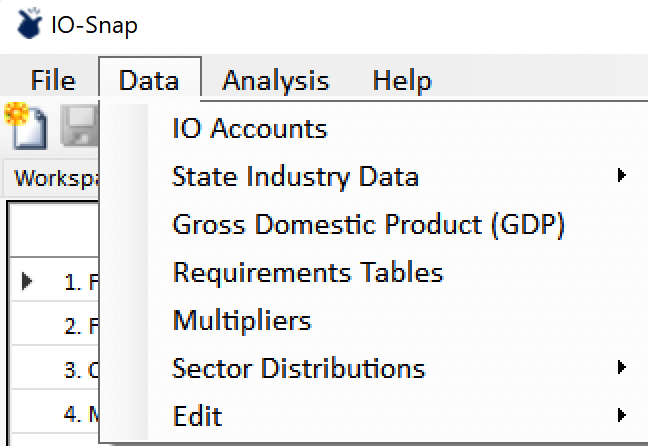
The Data menu item provides viewing general access to the default data that come pre-installed with IO-Snap and to data generated by the IO-Snap software. This page describes the various data displays.
IO Accounts
This option opens a form for selecting which accounts and which account tables to display.
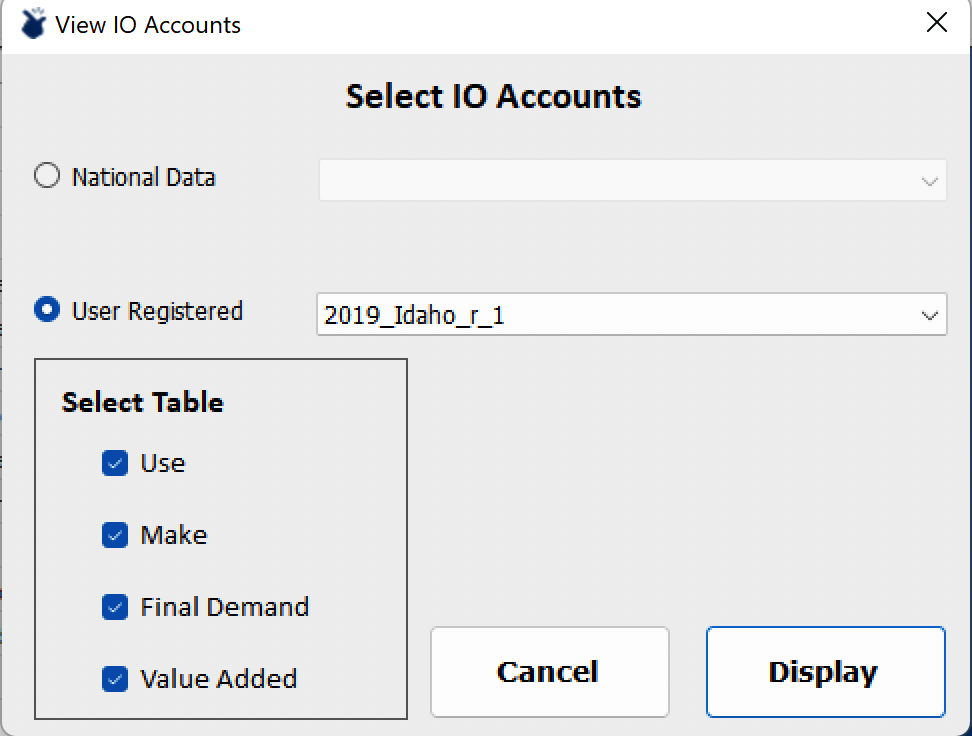
By default, the accounts selection items will be populated by the currently active accounts. However, users can select to display tables from other accounts within this window.
Clicking Display will add one tab per selected display table to the main window. The Summary function will work with each of these tabs and, like all other tabs (with the exception of the Workspace Summary), can be detached from the main window.

State Industry Data
The state industry data menu item provides access to data on compensation, employment, gross product and its components by industry, and with FTE-Job ratios by industry. FTE-Job ratios are national averages by industry.
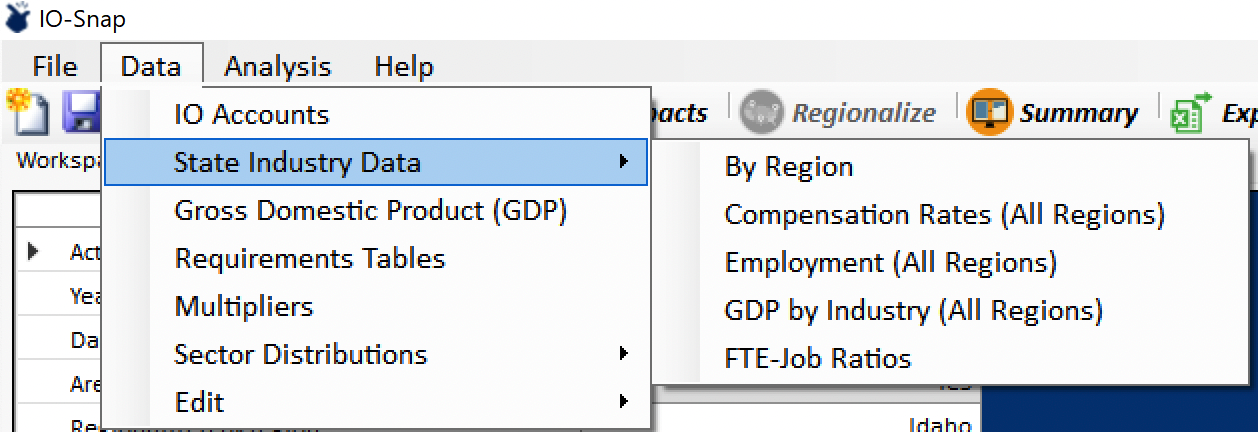
Selecting data By Region brings up a state selection form with a dropdown list for selecting a state. Selecting a state from the dropdown populates a window displaying Employment, Compensation per Employee, Employee Compensation, Gross Operating Surplus, Taxes, and Gross Industry Product for all industries in the state.
Compensation rates, employment, and total GDP by industry for all states can be viewed by selecting the corresponding menu items.
Note
To view these data for an historical year, select U.S. accounts for the desired year.
Gross Domestic Product
To view Gross Domestic Product, select the desired account from the Accounts dropdown list and Data > Gross Domestic Product (GDP) from the menu.
This will create a data tab and display gross product by expenditures and by income in the window.

Requirements Tables
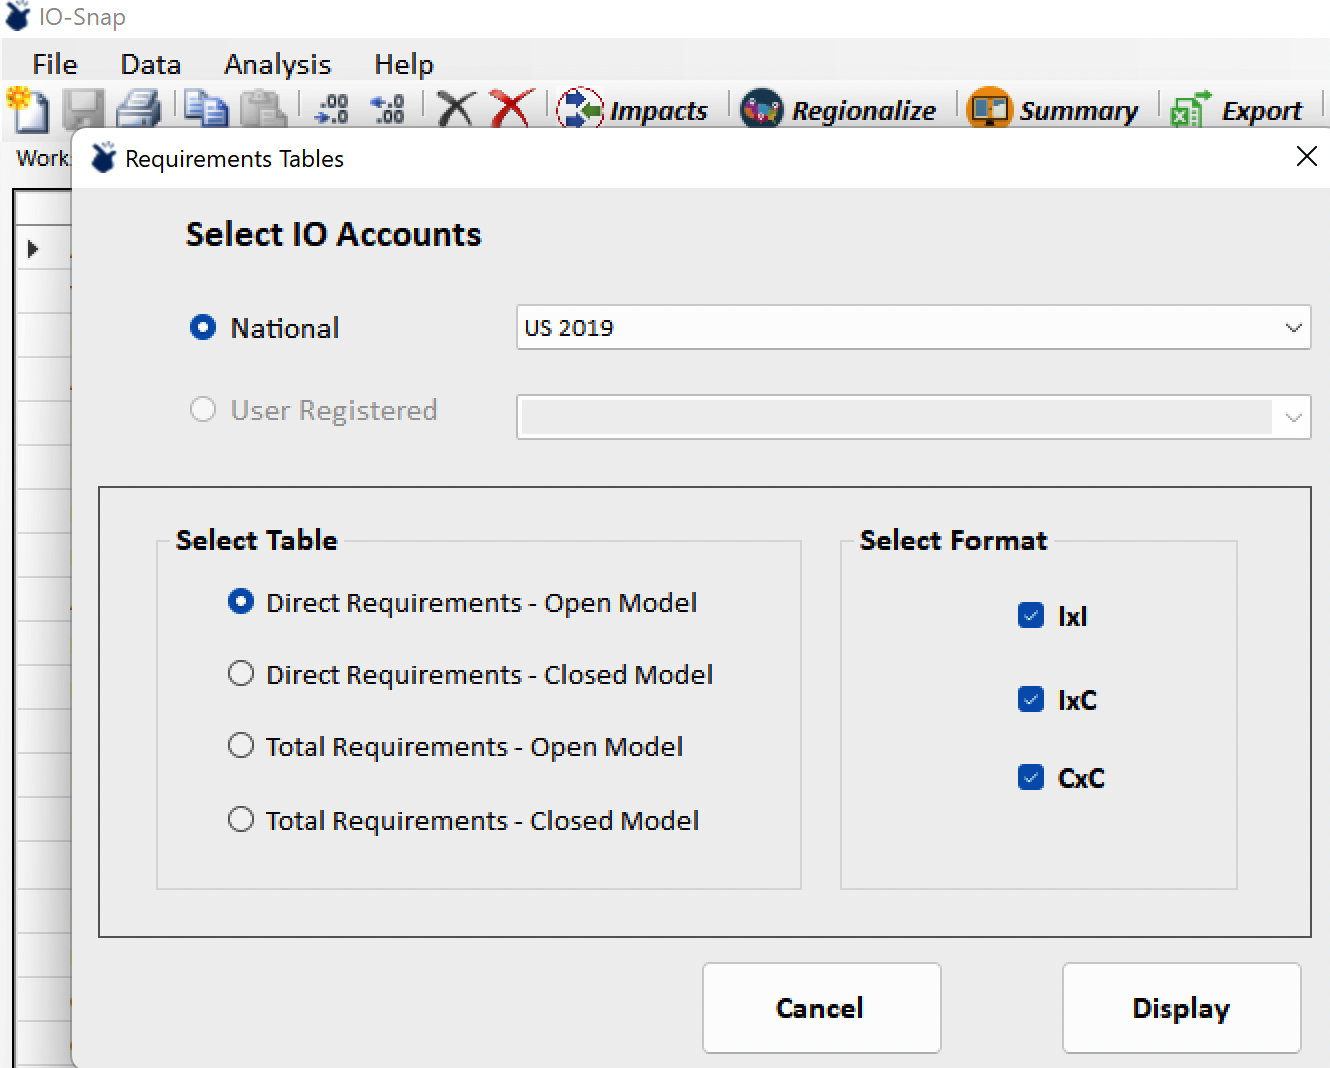
IO-Snap provides access to four different requirements tables in one of three configurations. Direct requirements tables are those that represent the share of total direct costs of for the column sector attributed to the row sector per dollar of column sector output. Direct requirements for Open (households exogenous) and Closed (households endogenous) Models can be viewed. Row and column sectors can be industries (I) and commodities (C), depending on the selected configuration. The three available configurations are IxI, IxC, and CxC.
The same three configurations are available for total requirements tables, which are the direct and indirect (Open Model) and direct, indirect, and income-induced (Closed Model) requirements per dollar of output delivered to final demand.
To view requirements tables, select the desired account from the Accounts dropdown list and Data > Requirements Tables from the main menu.
The accounts to be viewed can be altered in the Requirements Tables form by using the dropdown list fields provided there. Click Display to populate data tabs in the main window for each of the selected requirements tables. Only one kind of requirements table can be selected for display at a time, but users can return to the Requirements Tables form to generate others as desired. Each requirements table selected can be displayed in one, two, or all three configurations. Requirements tables are eligible candidates for the Summary feature.
Multipliers
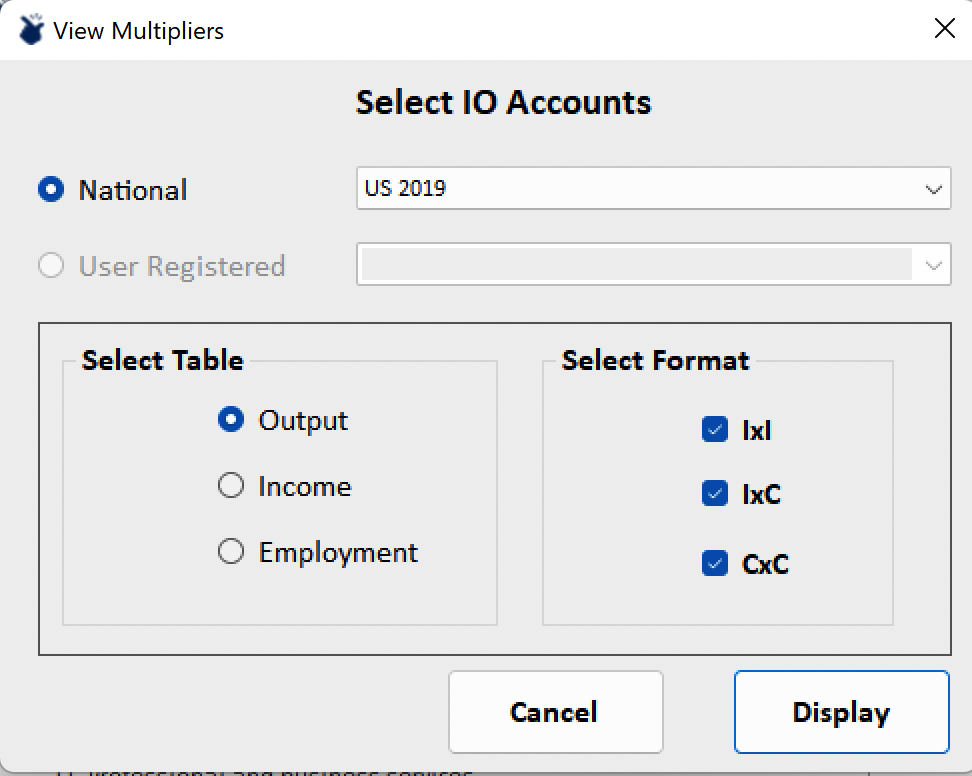
Input-output analysts often want summary measures for impacts assessments. The most common of these summaries is the multiplier. IO-Snap generates and provides viewing access to output, income, and employment multipliers in any or all of the three configurations (IxI, IxC, and CxC). To view multipliers, select the desired account from the Accounts dropdown list and Data > Multipliers from the main menu.
Output Multipliers
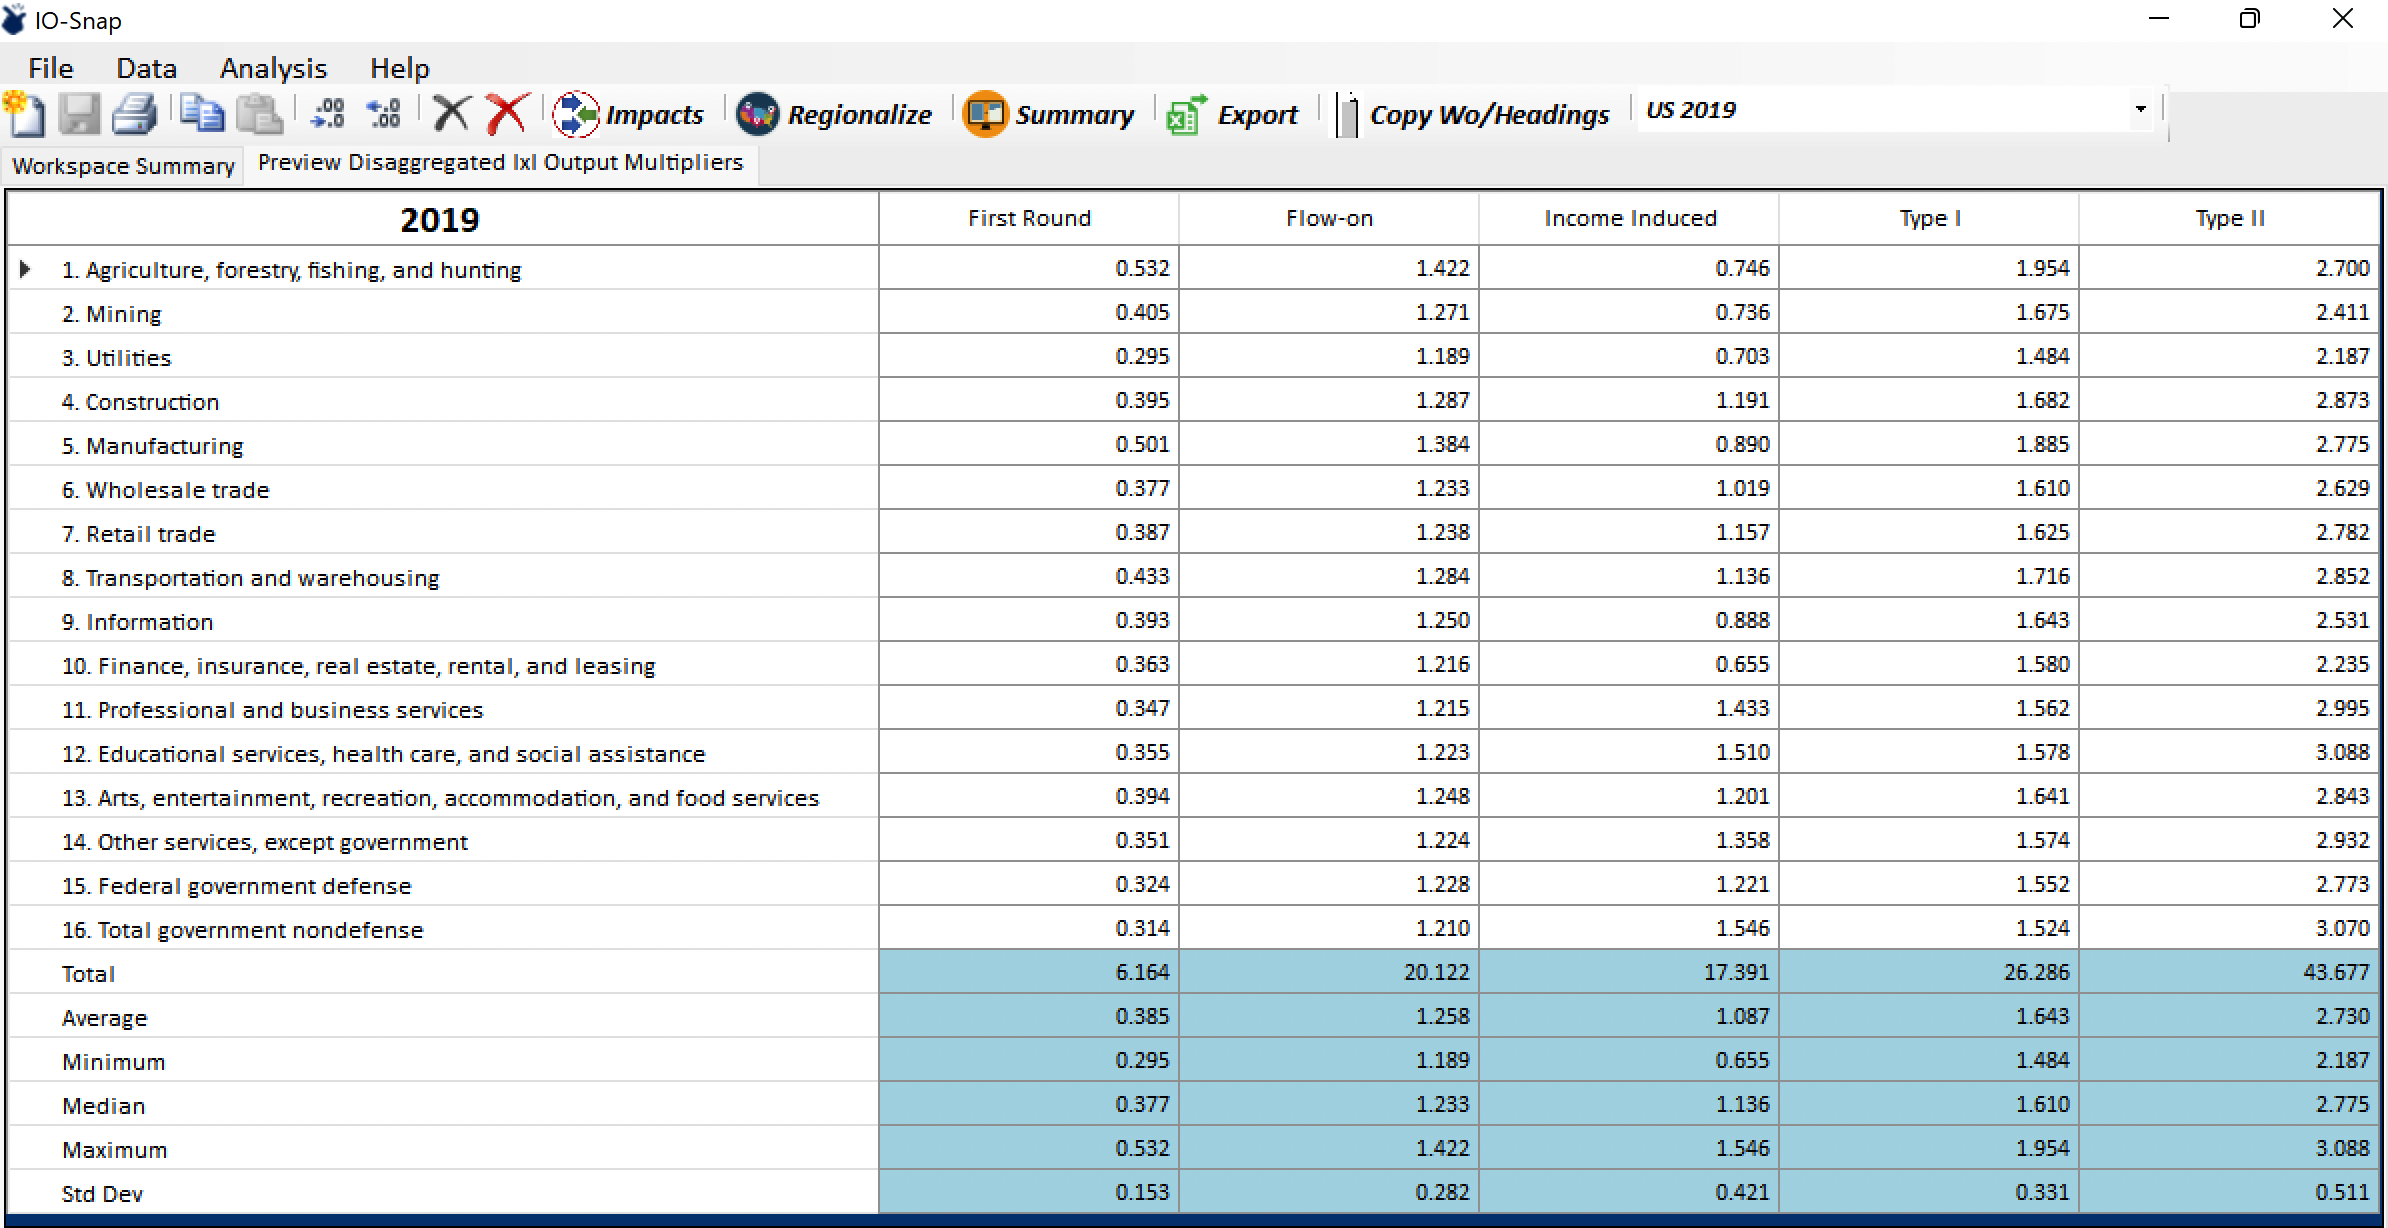
There are five columns in the output multipliers display windows, namely First Round, Flow-on, Income Induced, Type I and Type II.
First Round impacts are the row sector requirements from other sectors to produce one dollar of output. The name First Round comes from the power series expansion equivalent to the Leontief inverse matrix. First round impacts come from the “first round of spending” in the process of delivering product to final demand.
Flow-on impacts are the production related indirect requirements that result from all remaining rounds of spending, so that the sum of the First Round and Flow-on impacts is equal to the Type I output multiplier.
Income Induced impacts are those that are attributable to the respending of household income associated with each round of spending.
Type I multipliers represents the direct and indirect requirements from other sectors for the row sector delivery of one dollar of output to final demand.
Type II multipliers are equal to the Type I multiplier plus the Income Induced impacts.
Income Multipliers
IO-Snap generates income multipliers for IxI and IxC accounts only, because we have no way to directly measure income by commodity. There are five columns in the Income Multiplier display window.

The first column displays Income Coefficients for the row sector. An industry’s income oefficient is the income paid to workers per industry dollar output.
The second column reports Simple Multipliers by industry. The simple multiplier for an industry is the sum of the products of its column of direct requirements coefficients and the supplying industries’ income coefficients. In effect, an industry’s simple income multiplier is the income generated by and directly attributable to its first round of spending.
The third column displays Total Multipliers by industry. An industry’s total multiplier is the total income associated with the delivery of a dollar of its output to final demand, including the income attributable to induced-income impacts. The total multiplier is, therefore, equal to the household row value in a total requirements matrix industry column from a closed model.
The fourth and fifth columns in the income multiplier display are equal to the simple and total income multipliers divided by their respective income coefficients. Type I and Type II income multipliers are therefore directly analogous to output multipliers, in that they display the direct and indirect impacts – or the direct, indirect, and income-induced impacts – relative to the direct impacts (income coefficients).
Note
Because some income coefficients can be quite small, Type I and II income multipliers for those industries can be much larger than their respective Type I and Type II output multipliers.
Employment Multipliers
IO-Snap generates employment multipliers for IxI and IxC accounts only, because we have no way to directly measure employment by commodity. There are five columns in the Employment Multiplier display window.

Like income, we employment per output dollar can be measured directly. The first column reports employees per million dollars of output. Despite their larger absolute values, we will refer to these ratios as employment coefficients. The remaining four columns are analogous to the Simple, Total, Type I, and Type II income multipliers.
The second column reports Simple employment multipliers. For any industry, the simple employment multiplier is the employment generated by and directly attributable to first-round spending for the production of $1M of output.
The third column reports Total enmployment multipliers. For any industry, the total employment multiplier is the total employment associated with all rounds of spending for the delivery of a million dollars of its output to final demand, including the employment associated with induced-income impacts.
The fourth and fifth columns are equal to the simple and total multipliers divided by the employment coefficients, analogous to Type I and Type II employment multipliers.
Note
Because some employment coefficients can be quite small, Type I and II employment multipliers for those industries can be much larger than their respective Type I and Type II output multipliers.
Sector Distributions
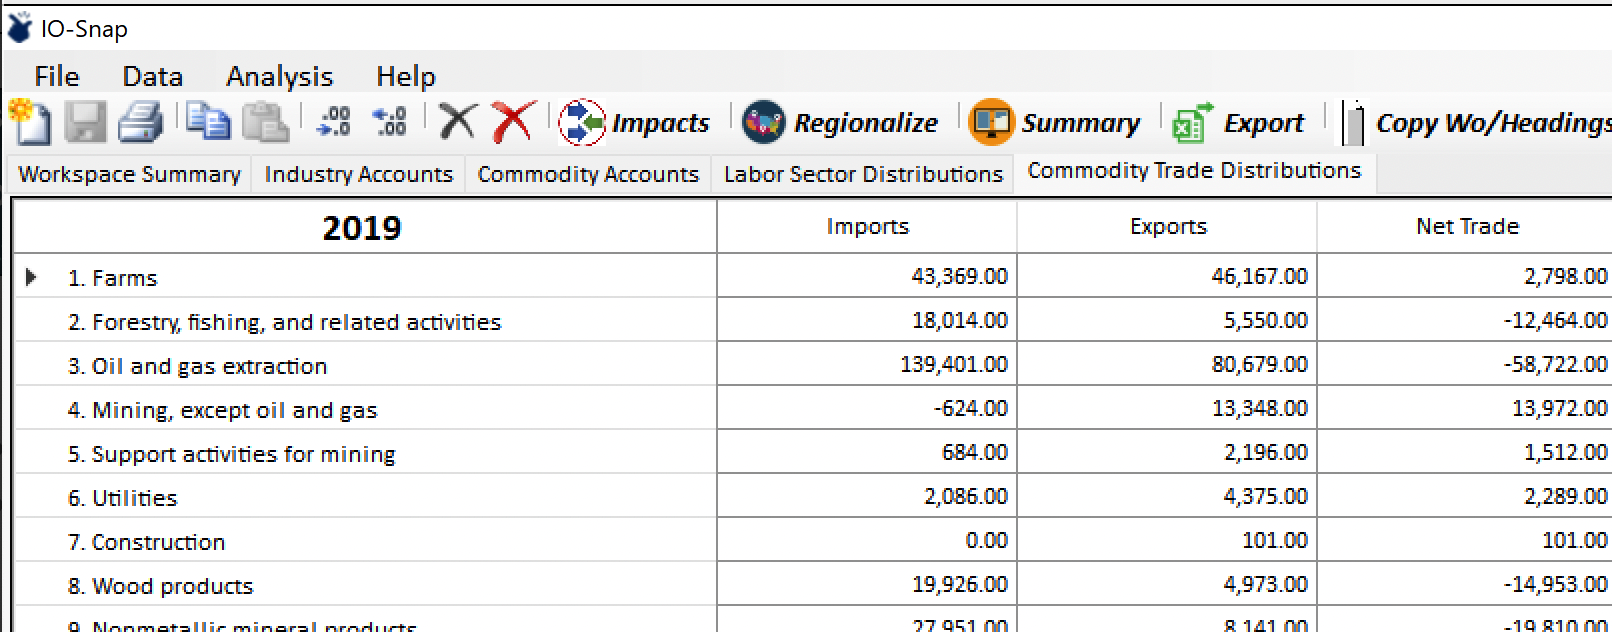
The Data > Sector Distributions menu item provides supplementary information related to the industries and commodities in the active accounts. Industry and Commodity Accounts data, Industry Labor data, Commodity Trade Balance, and Regional Supply Percentages can be accessed via Sector Distributions.
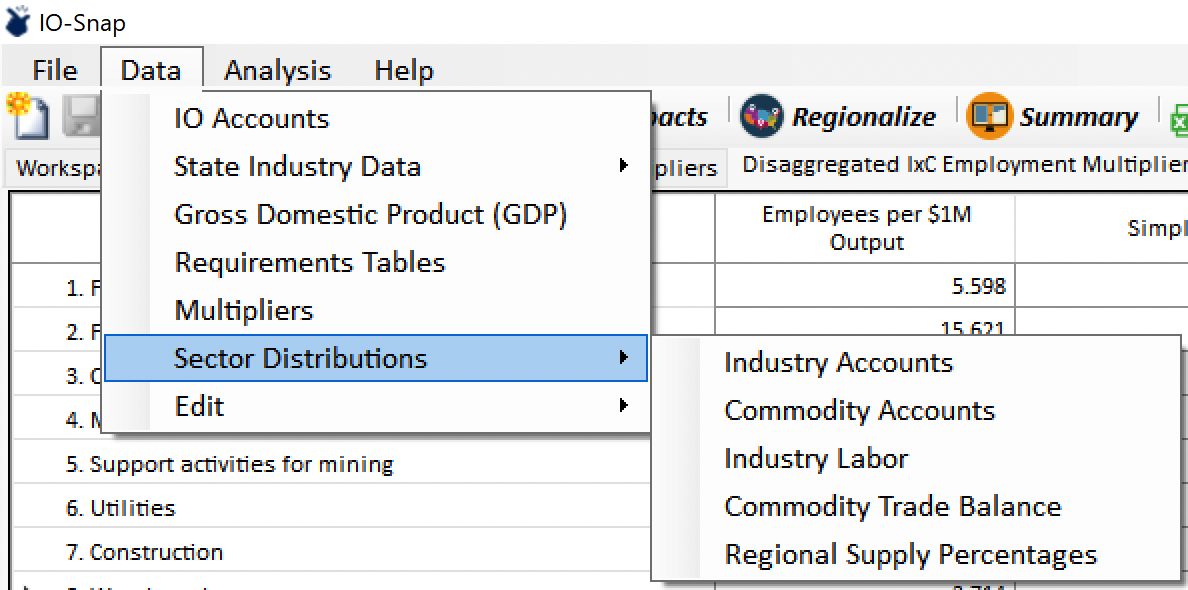
Industry Accounts
Industry Accounts include Total industry output, Intermediate input, Employee compensation, Gross operating surplus, Taxes (payments to government), and Total value added.

Commodity Accounts
Commodity Accounts include Total Commodity Output, Intermediate Demand, and all of the final demand activities, including Consumption Demand.

Industry Labor
The Industry Labor report displays Employment by Industry, Employee Compensation, Compensation per employee, and Employees per $1M output.

Commodity Trade Balance
Commodity Trade Balance reports Imports, Exports, and Net Trade.
Regional Supply Percentages
Regional Supply Percentages are estimates of an economy’s ability to satisfy commodity demand. Consult the technical documents on the EconAlyze, LLC website for more detail on IO-Snap regionalization procedures.
