Regionalization
Contents
Regionalization allows users to generate subnational U.S. input-output accounts. This is achieved by modifying corresponding year national accounts to accommodate and reflect differences between the subnational region and the nation. The output levels and distributions of industry activity will vary, as reflected in the regional accounts.
IO-Snap distributions include data for all U.S. states and Washington, D.C., for all years from 1998 through the most recent data update year. States can be combined to generate accounts for larger geographical areas, such as Census or Bureau of Economic Analysis regions. IO-Snap also facilitates the generation of input-output accounts for substate economic aggregations. This page describes the various regionalization options available.
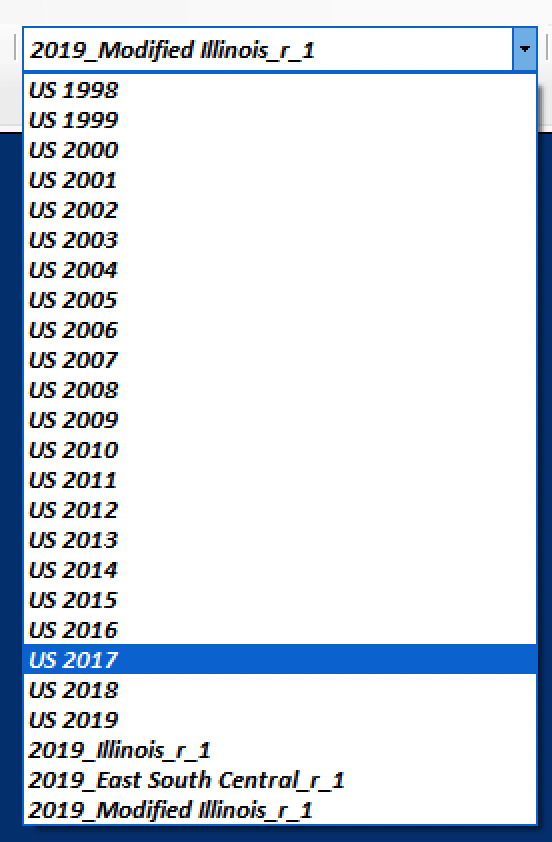
Regionalization begins by first selecting the U.S. national accounts for the desired year from the Accounts dropdown list. These are the accounts to be regionalized, and only national accounts can be regionalized. Next, either navigate to the Analysis > Regionalize menu item or click on Regionalize in the Ribbon. Either method brings up the Regionalization Method Selection dialog:
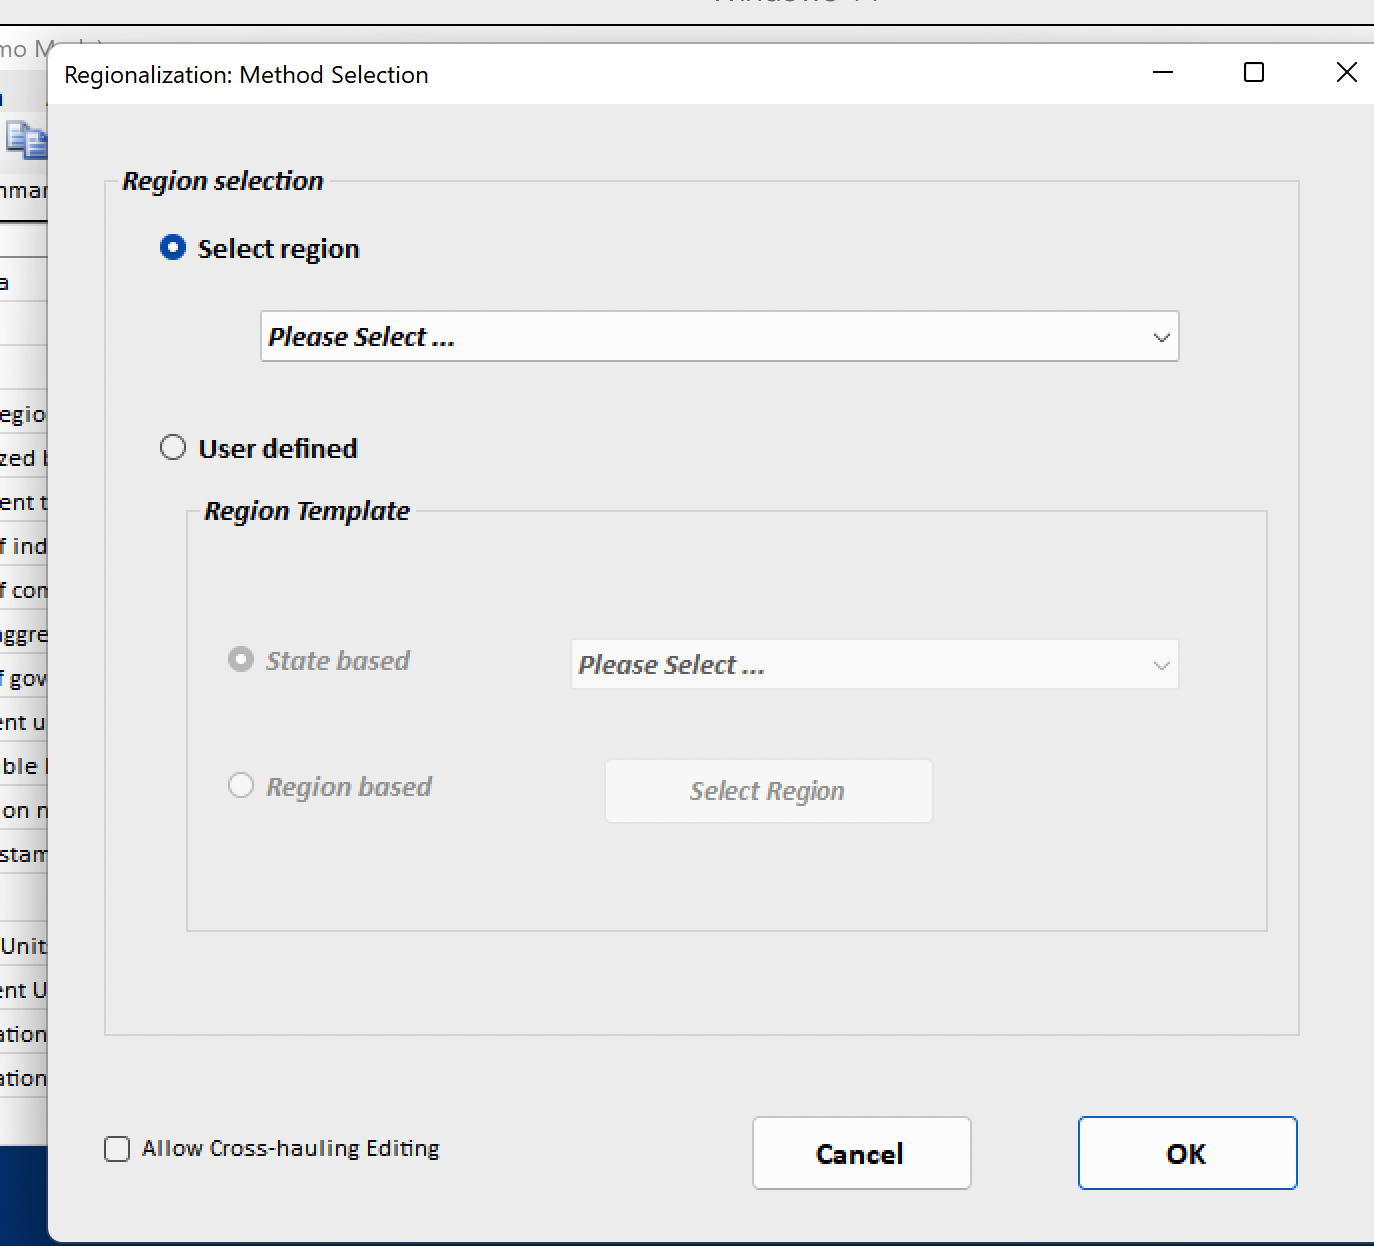
Region Selection
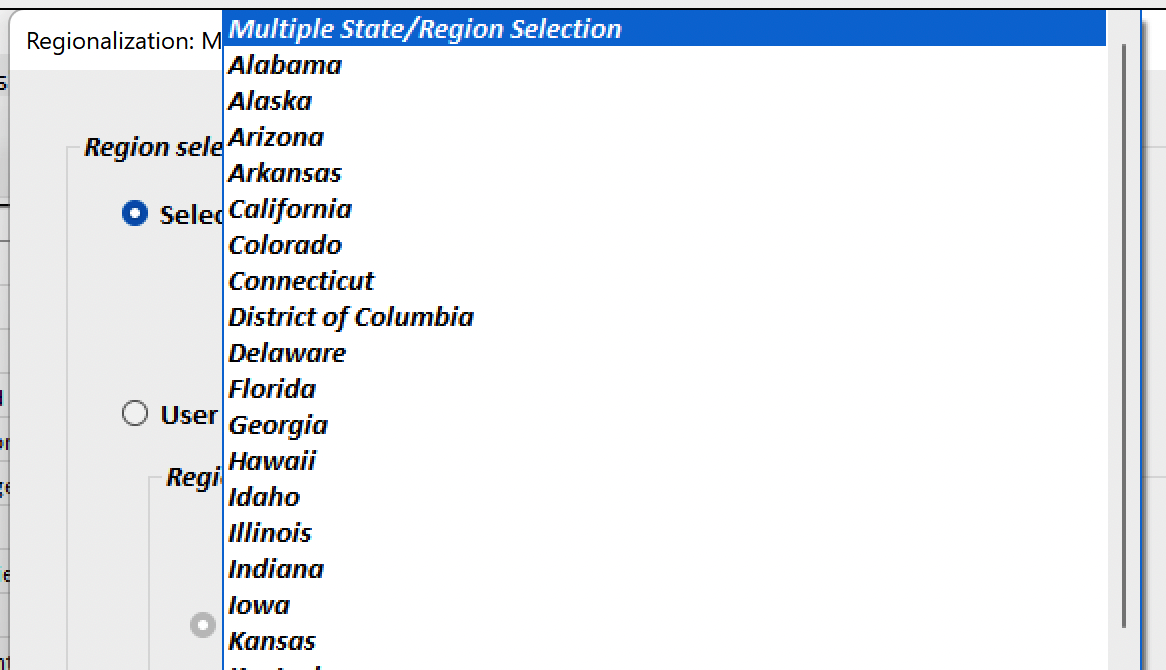
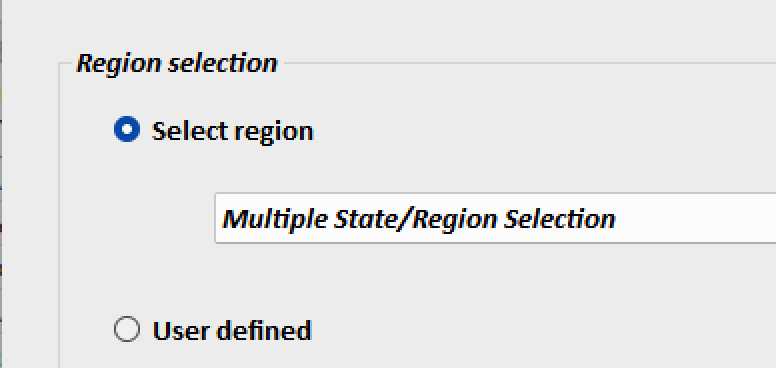
To begin the regionalization procedure and with the “Select region” option indicated, click in the dropdown list field to bring up a list of choices of geography, including each state individually and the Multiple State/Region Selection options.
Select region
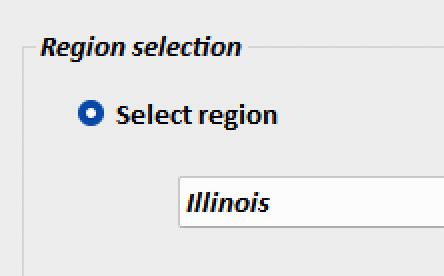
The simplest option is to select a single state, e.g., Illinois.
After selecting a state, click the OK button to be presented with an IO-Snap Dataset Name dialog and a default name for the new regional accounts. You can enter a name of your choice in this field or accept the default.
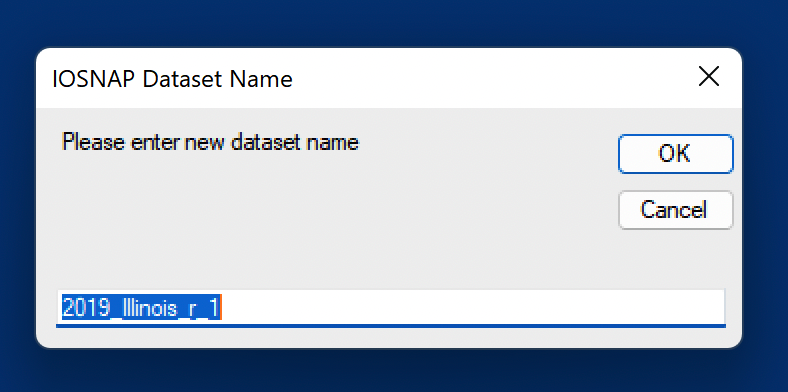
In this example, using 2019 Illinois as the subnational region, we use the default dataset name. Clicking OK in the name selection dialog box initializes the new Illinois accounts (in the background) and makes them the active accounts. This is now reflected in the Accounts dropdown list and in the Workspace Summary. The workspace summary will now reflect the metadata relevant to the newly active 2019 Illinois accounts.
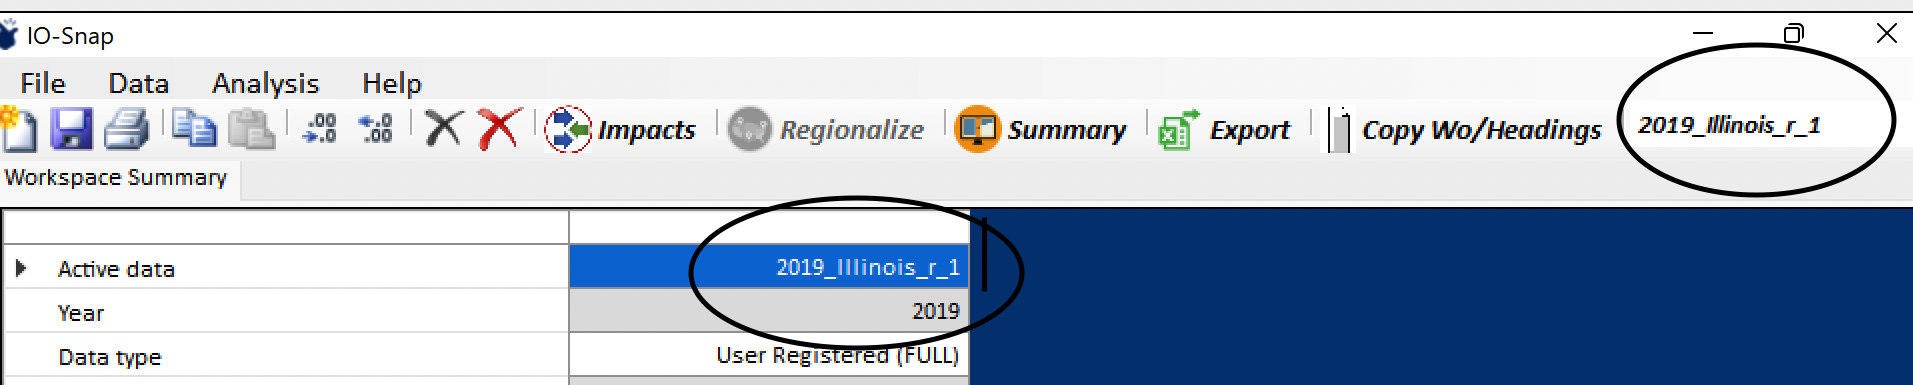
While the new Illinois accounts are active, they will be used by any accounts-specific IO-Snap features, including viewing the accounts, multipliers, or other options under the Data menu item, and in impacts assessments. Whether national or subnational, any displays and features that are region-specific will reference the active accounts displayed in the Accounts dropdown field.
MultiState Region Construction Form
Returning to the Regionalization procedures, a second option is to generate regions that combine two or more states (and D.C., which is always implied in references to “states”).
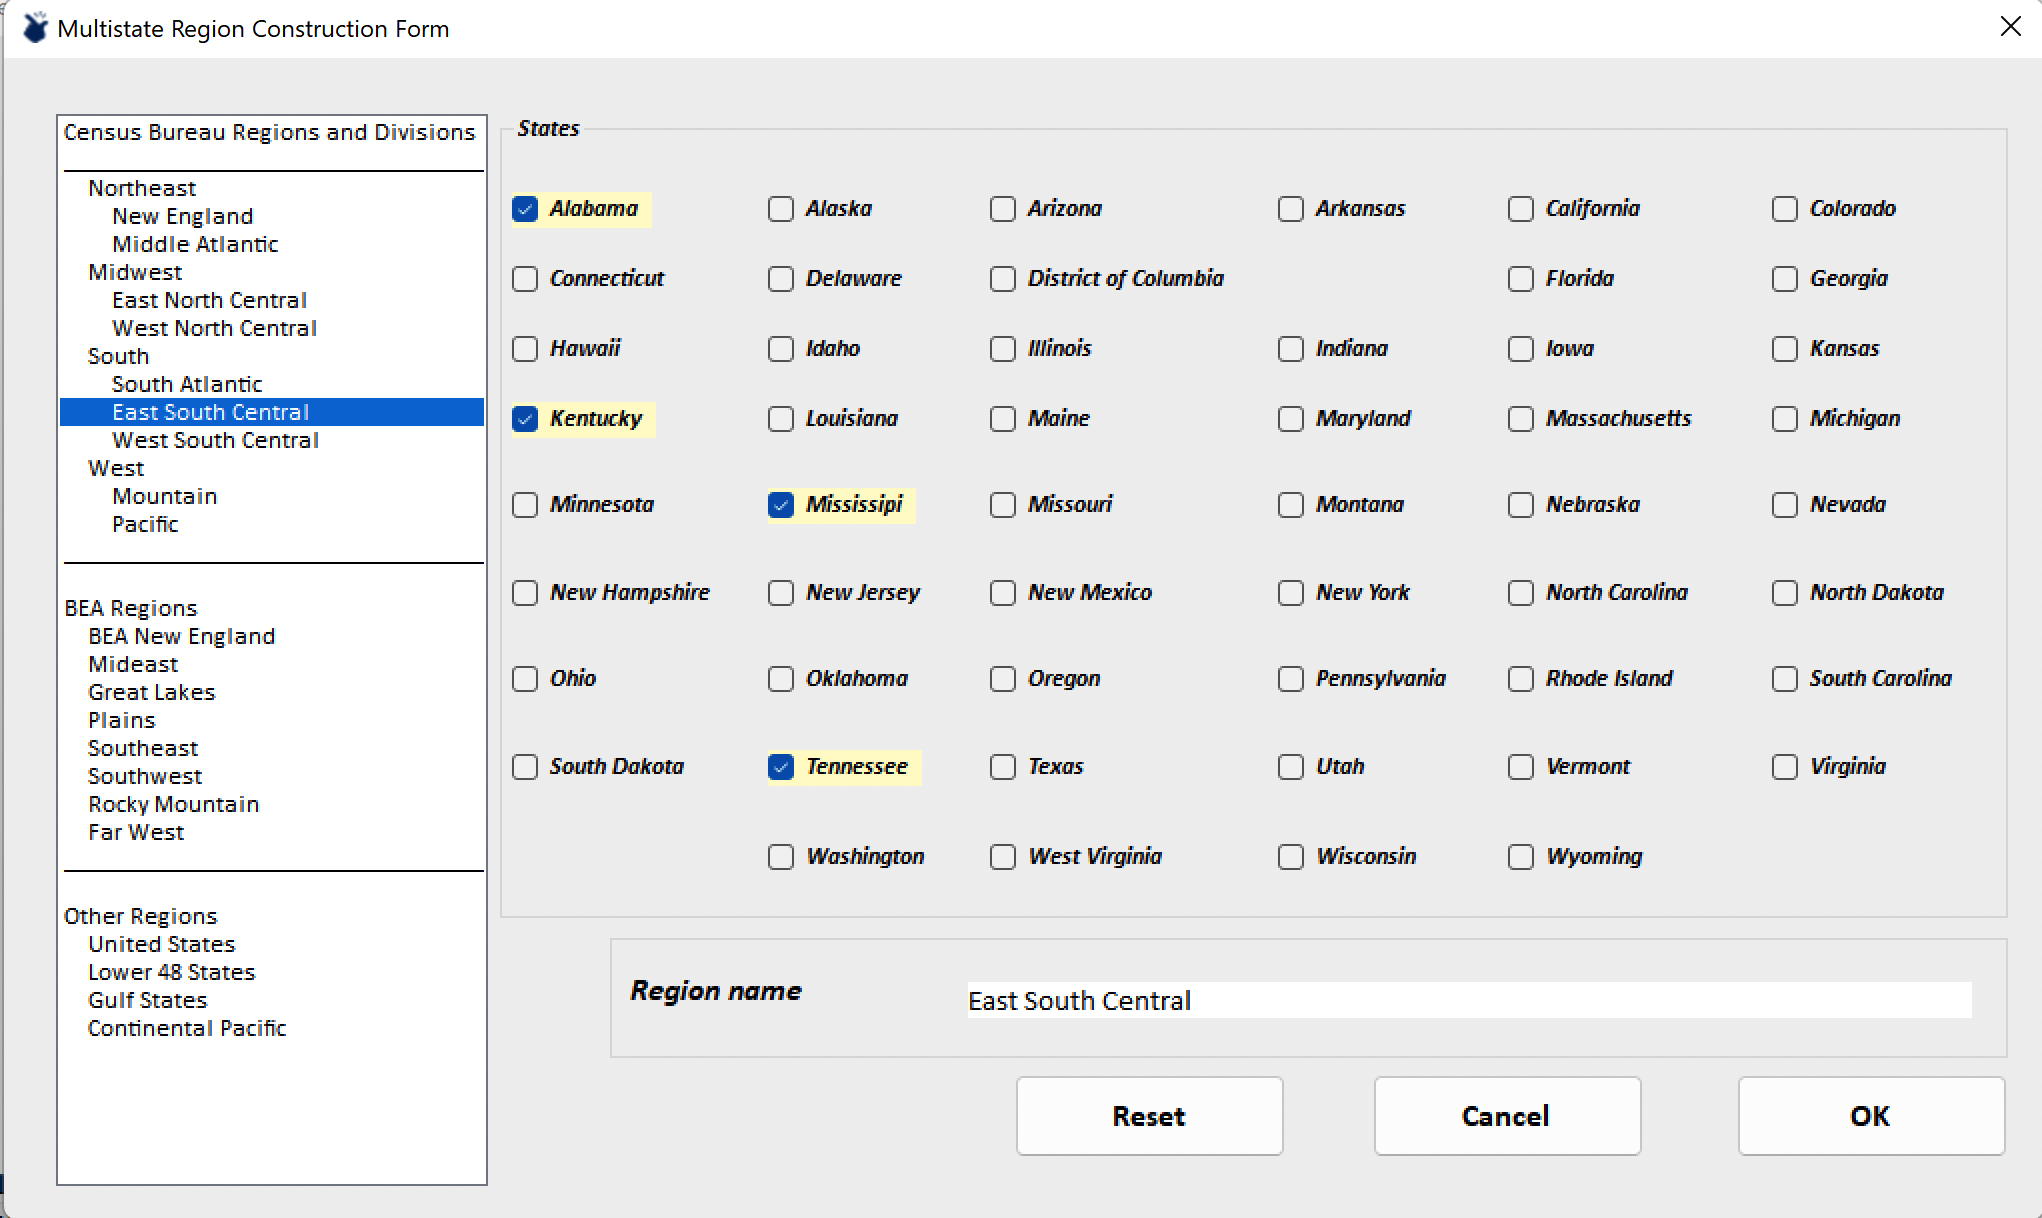
After selecting Multiple State/Region Selection, clicking OK, brings up the Multistate Region Construction Form. Users can select regions of their own design, or can use the list of pre-defined regions in the selection panel at left. Below, you will see that the East South Central Census Bureau Region has been selected and the corresponding states are indicated in the right panel. States can be added to or removed from pre-defined regions. An editable suggested name for these regional accounts has been entered in the Region name field.
User defined
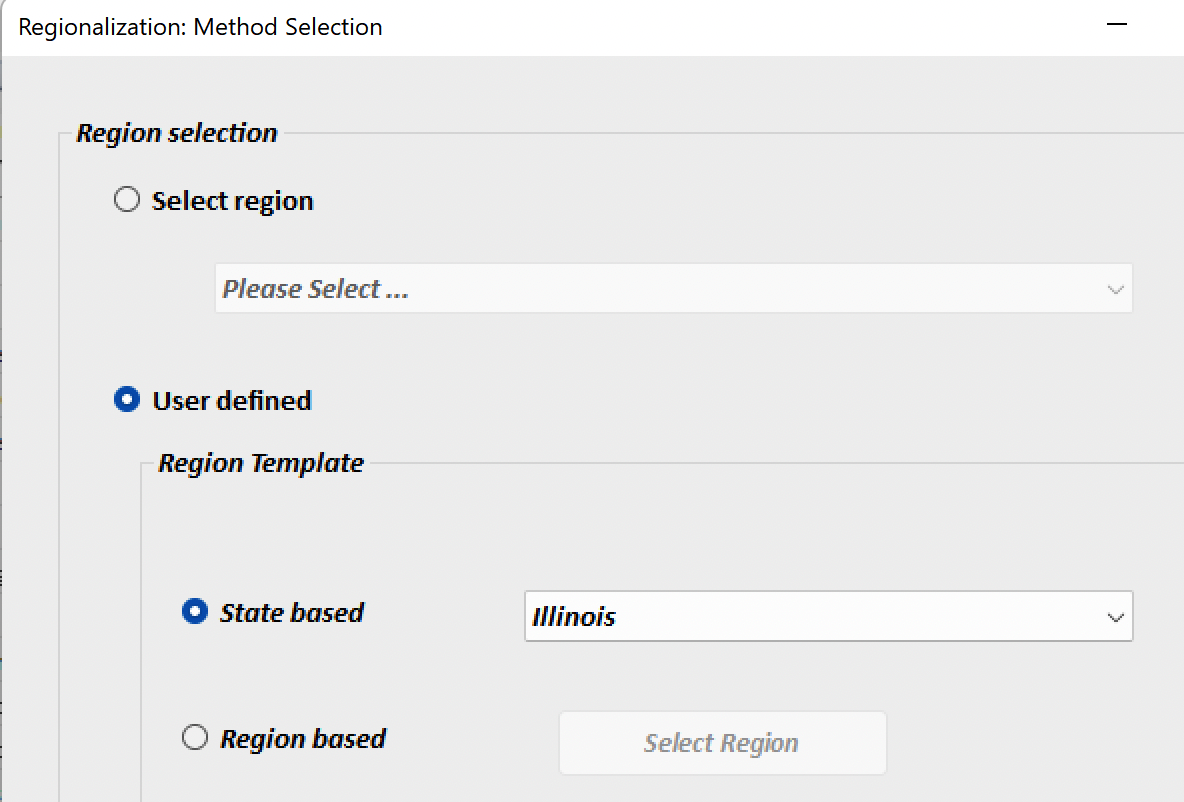
Whereas the single or multi-state regionalization options support standalone or combinations of default state data, the “User defined” option allows users to modify data for states or multi-state regions. In addition to exploring how the regionalized accounts would differ under assumptions of larger or smaller regional industries, this option also supports regionalization for substate regions or regions composed of counties in contiguous states.
Note
IO-Snap does not check for contiguity of constituent states when specifying multi-state regional definitions.
The IO-Snap regionalization method relies heavily on BEA Employment and Gross Product by Industry data. These are the primary data that drive the IO-Snap regionalization process. These variables for substate economic regions are generally scarce and when available, they tend to be reported only with less detail, sometimes also with substantial portions of the data unreported due to disclosure rules and therefore go unreported.
If a user has data for subnational regions for a subset of the variables that drive regionalization, values for missing variables can be derived from known relationships among variables. If one has compensation data for an industry, for example, employment level can be derived by using the reported compensation data in conjunction with the average wage rate (compensation/employment) in that industry. (In economics circles, this is known as the Kendrick-Jaycox method for estimating missing values – in case you ever need a fancy term for it!) However, we know that wage rates – as with other inter-variable relationships – vary geographically. So, rather than using a national wage rate to derive a substate regional variable value, we would prefer to use a wage rate for the state in which the region is located. Or, if the substate region were composed of counties in each of two (or more) adjacent states, it would make sense to use the average wage rate for that multi-state region as the basis for Kendrick-Jaycox derivations.
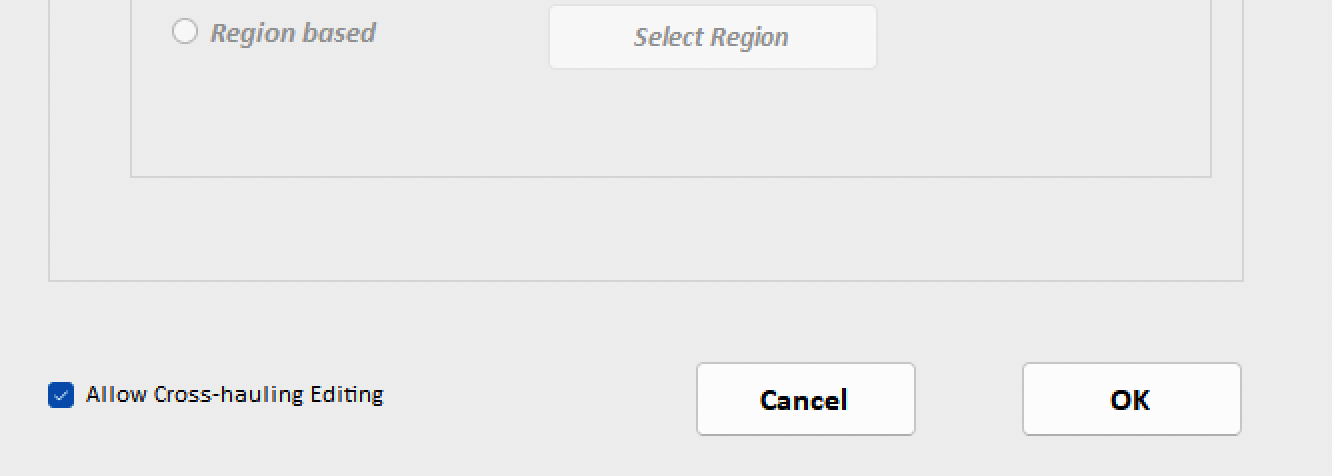
To support a user who wishes to build substate accounts, then, IO-Snap allows users to select a template region for Kendrick-Jaycox derivations. The User defined regionalization option is designed to do just this. Selecting the State based option allows the user to select a single state as a template for inter-variable relationships, while the Region based option opens the multi-state region selection dialog to allow users to create a multi-state template region.
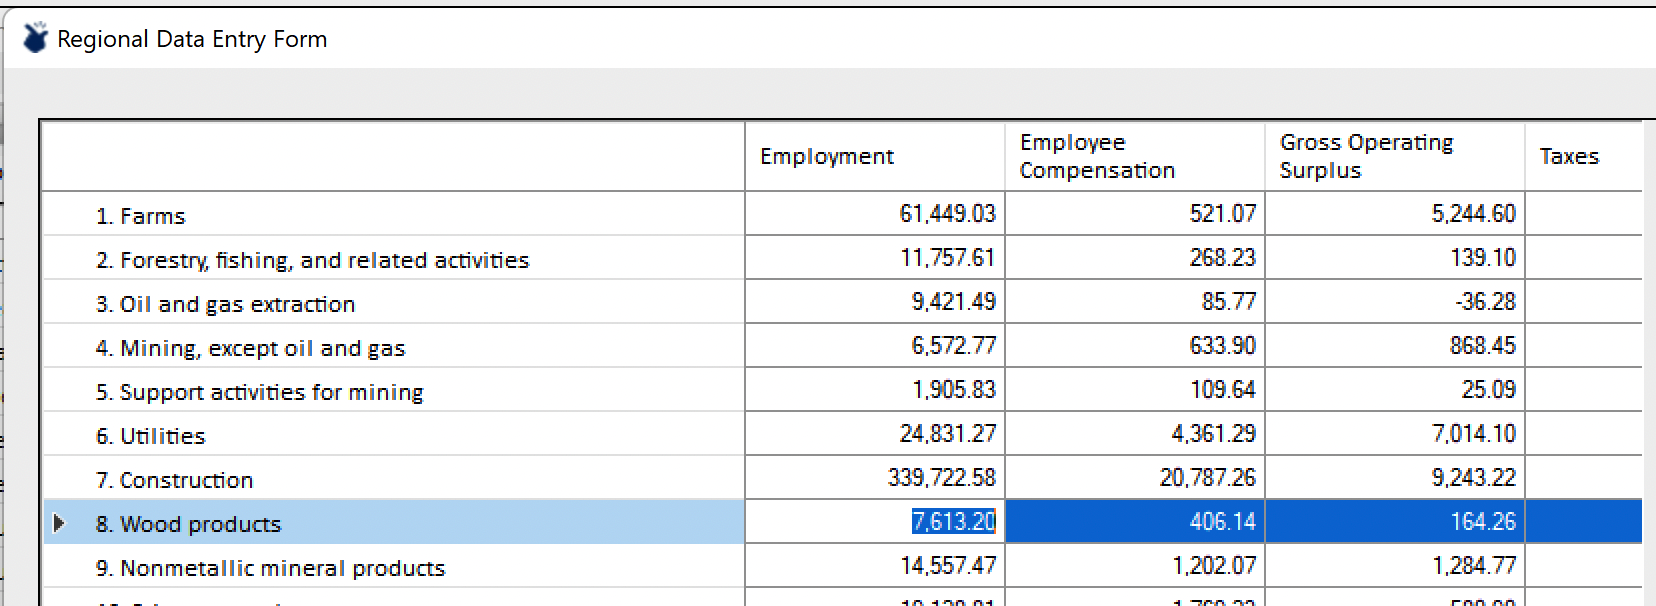
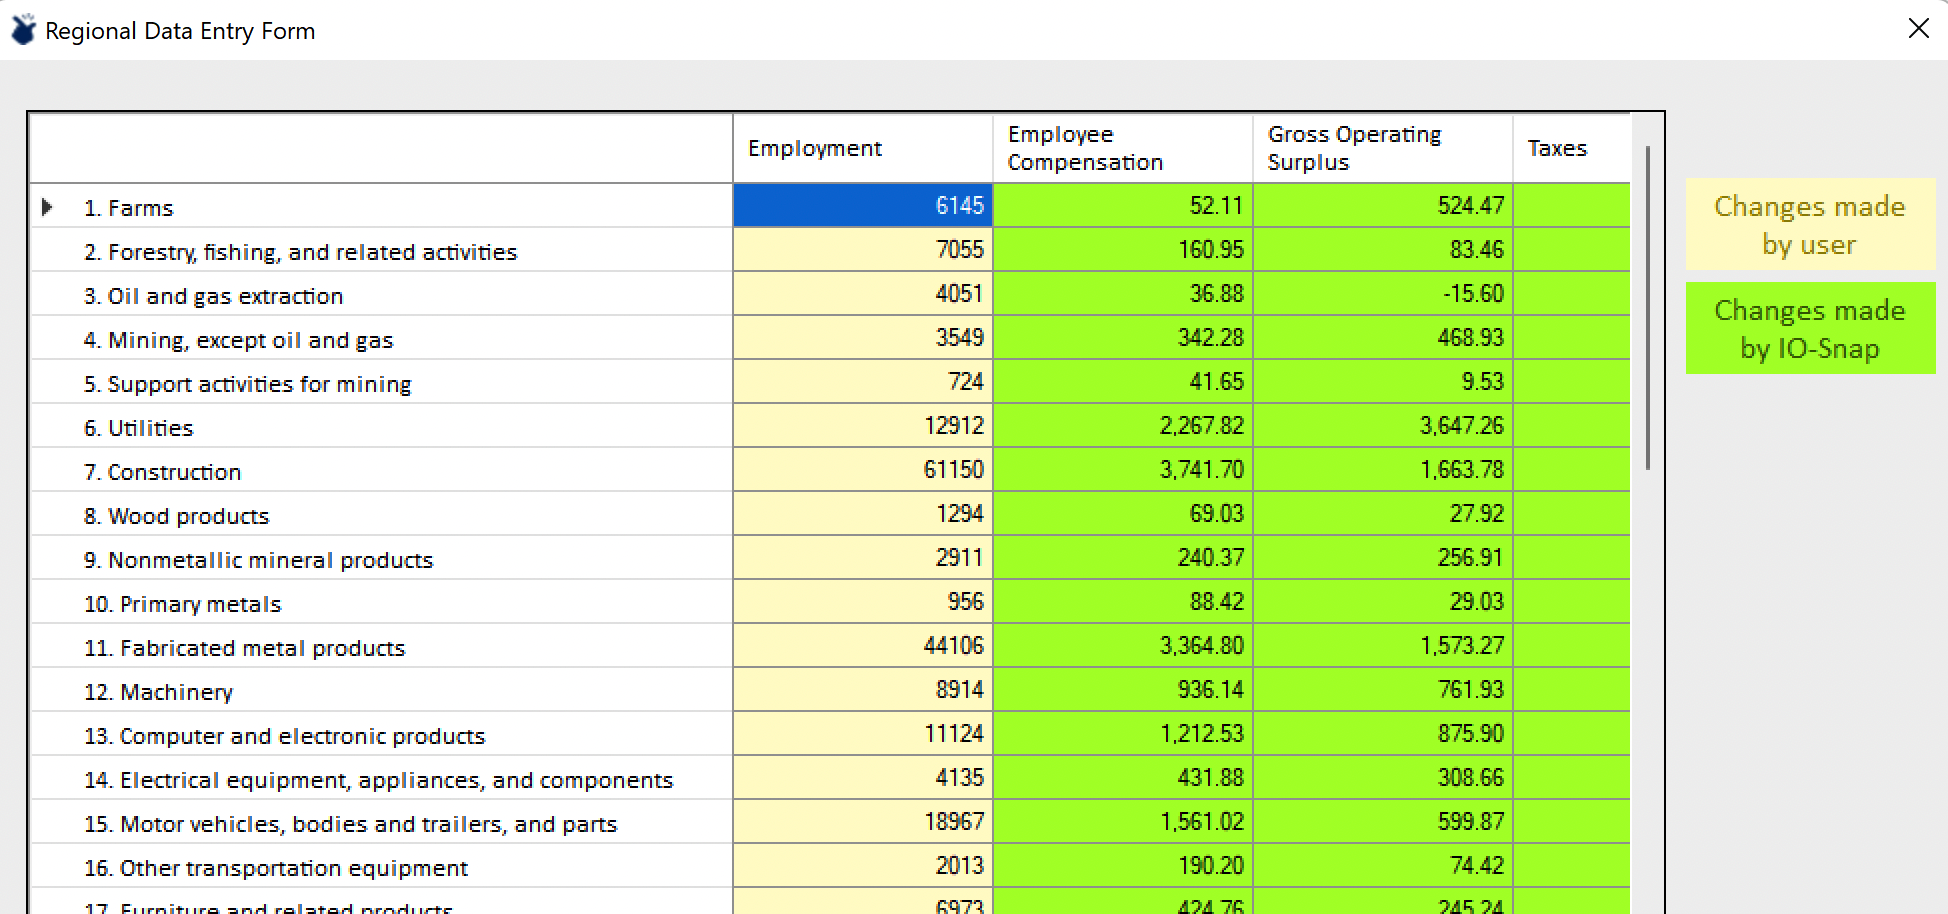
Selecting the template region (Illinois in this example) and clicking OK opens the Regional Data Entry Form. It is populated by the values for Employment, Employee Compensation, Gross Operating Surplus, Taxes, and Gross Product by industry. Users who simply wish to see the accounts corresponding to an expansion of an industry, e.g., Wood Products, can modify one of the variables in that industry’s row to correspond to the expansion.
For example, the original value could be increased by 1000. After doing so and clicking on Proceed presents a warning.
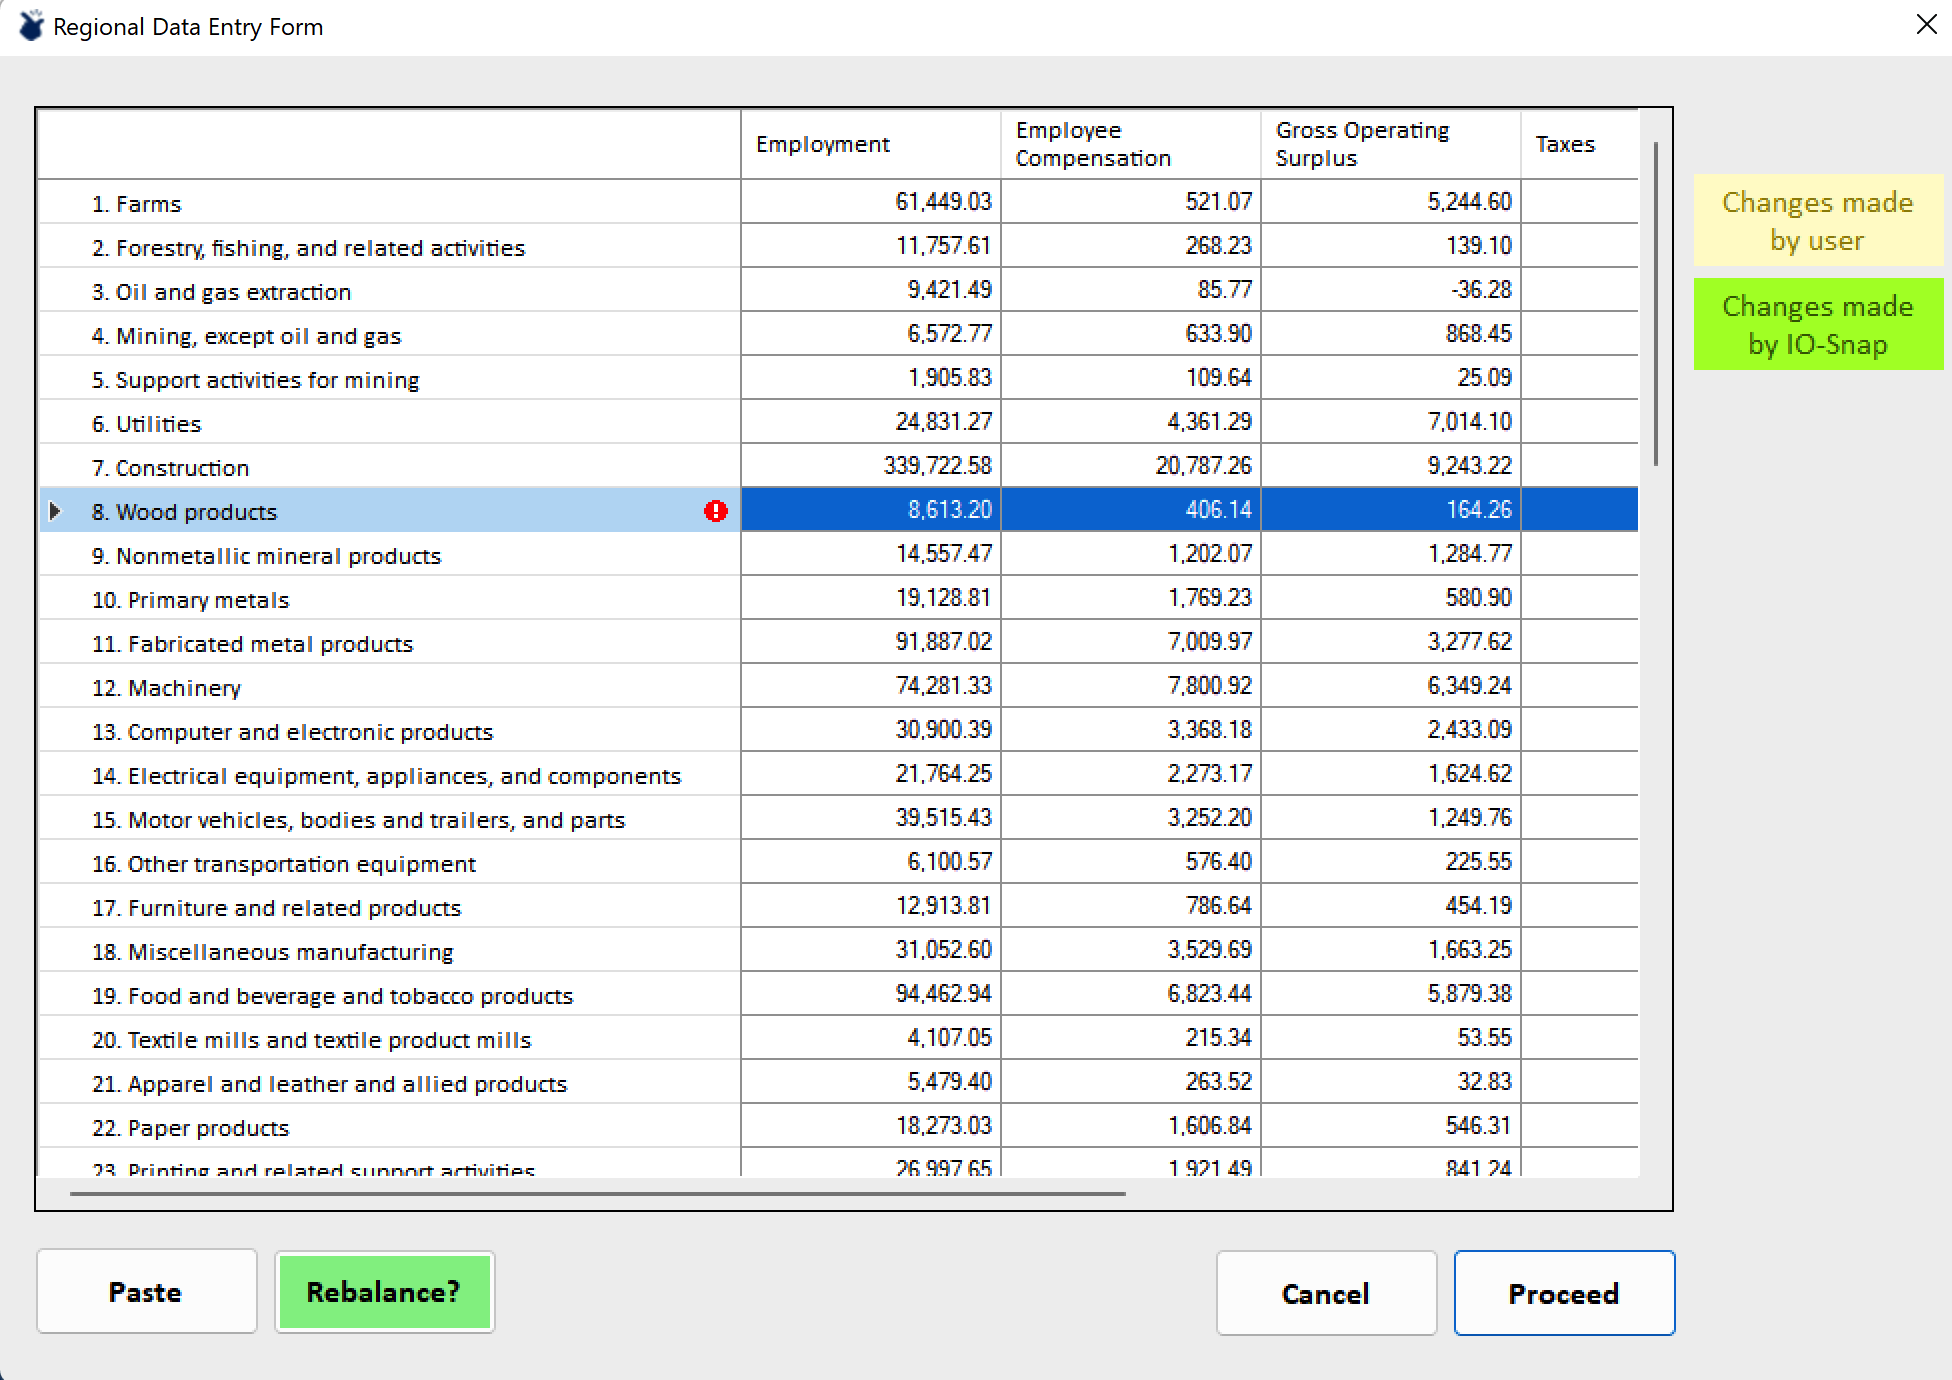
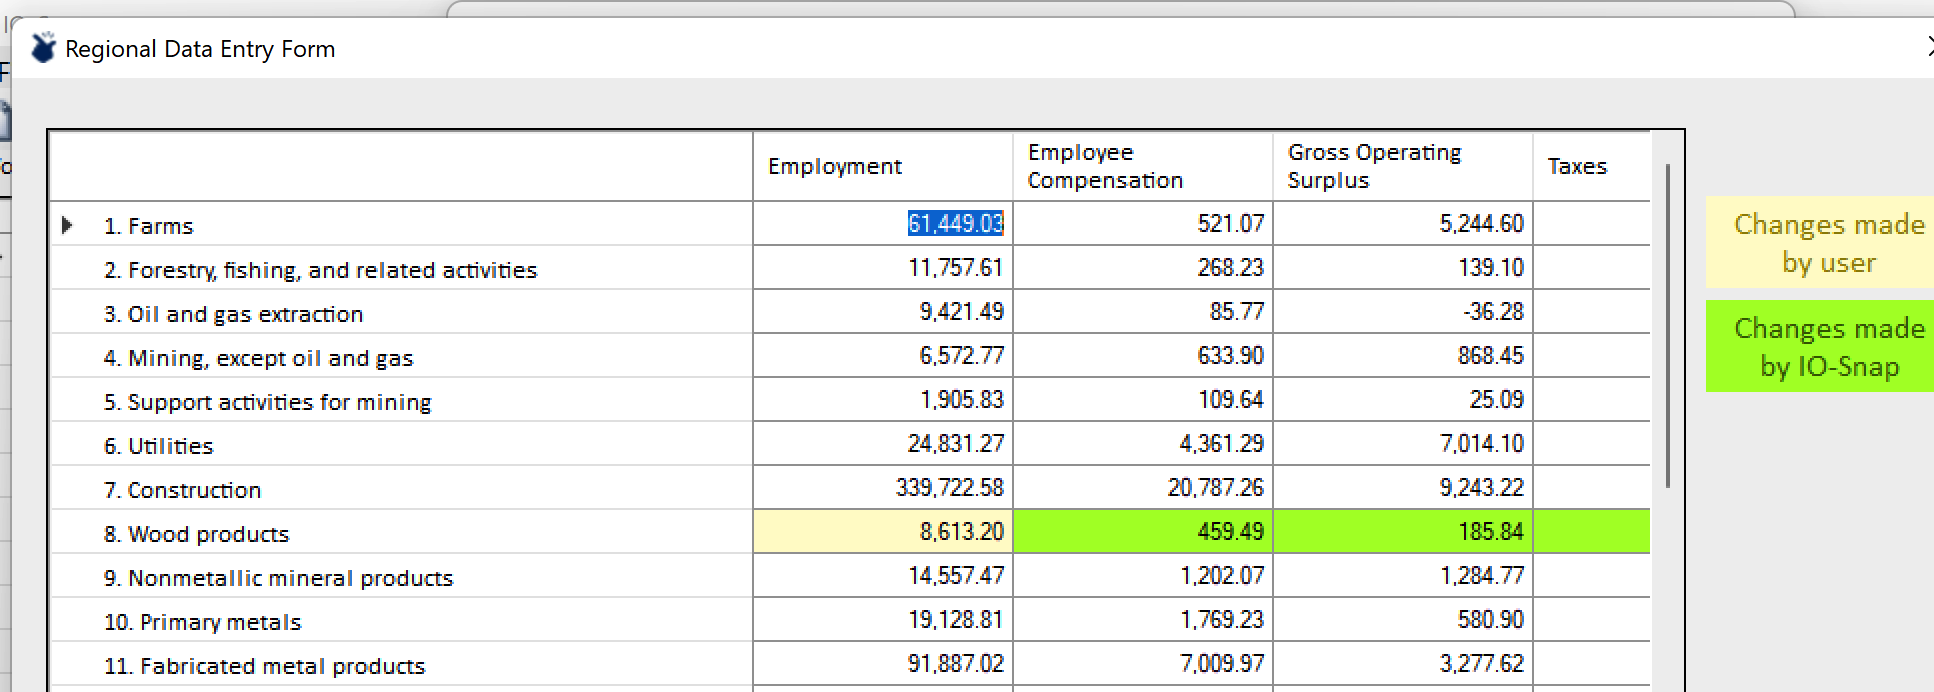
The red exclamation mark alerts the user to the fact that although the employment value has changed, no other industry values have been. This results in unusual and potentially unacceptable inter-variable relationships, e.g., wage rates. If employment is increased but compensation is not, as in this example, wage rates will have declined implicitly as a result. The Rebalance button restores the inter-variable relationships to those of the templat region, but respecting and retaining the new employment value. The resulting values are shaded to identify user- and IO-Snap modified values.
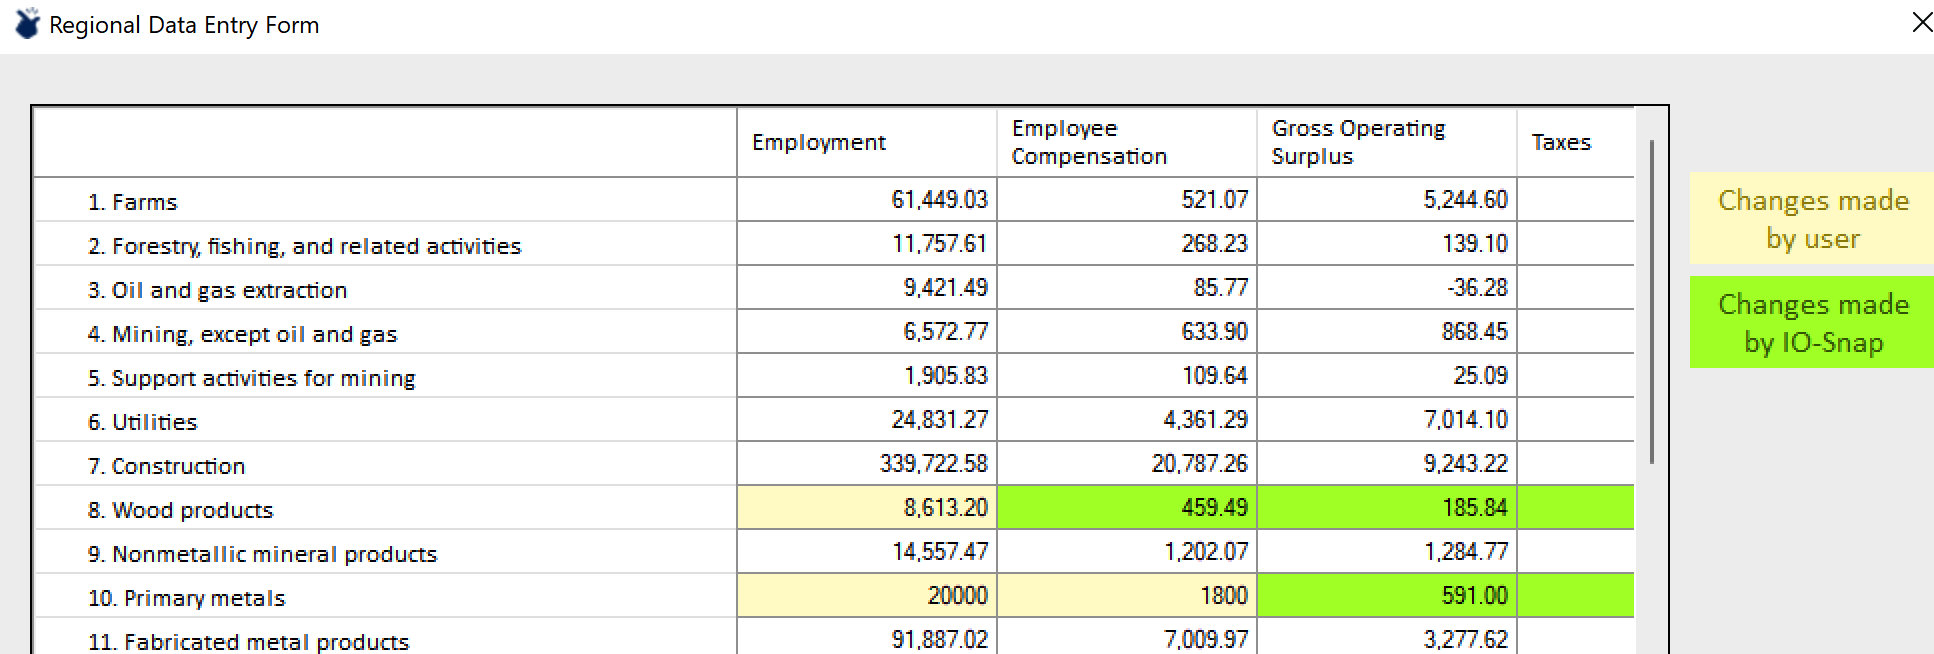
Users can enter both employment and compensation data, but IO-Snap will recognize that the industry gross product values (the sum of compensation, gross operating surplus, and taxes (payments to governments) are no longer consistent with the regional template and will not allow the user to proceed until the balance is restored. Entering both new compensation and employment values then Rebalancing will balance the other gross product components and respect the user-entered compensation and employment values, as shown in the Primary Metals example below.
Industry row values that respect the gross product component balance will not result in user alerts.
When a user has values for, say, employment by industry for a substate region, these values can be pasted in as a group (column vector) and rebalanced all at once. The result will look like this.
Once satisfied with the template region edits and having rebalanced as needed and selecting Proceed, users can name their new accounts in an IO-Snap Dataset Name dialog and click OK to create the new accounts, which will become the active accounts (as with the other regionalization options).
At this point, we have generated accounts for Illinois, for the East South Central Census Region, and for a hypothetical substate Illinois region. All of these accounts remain available for viewing or use in impacts assessments, as can be verified by opening the Accounts dropdown.
All generated accounts remain available during the current work session, unless File > Program Reset is activated. Users can use the Program Reset feature to clear unwanted accounts from the current session. Likewise, users can save generated accounts for work in future sessions by making the desired accounts active (selecting them from the dropdown) and using the File > Save Data to save the accounts, then File > Load Data to access them in a future session.
Cross-hauling (Advanced)
The final option on the Regionalizatin Method Selection form is to Allow Cross-hauling Editing. IO-Snap uses a cross-hauling enabled extension of the Supply-Demand Pool regionalization method. The technical details of our methods, including cross-hauling estimation, are described fully on the IO-Snap Technical Documents webpage.
Cross-hauling occurs when goods in the same commodity classification are both exported and imported. Cross-hauling is partly due to broad aggregate sectoral classifications. When a commodity sector, say, chemical products, includes similar but different products, e.g., cleaning supplies and paints products, then the cross-hauling that occurs is not of identical products. This is a product mix issue. But cross-hauling can also occur when the products are effectively identical, as with hand soaps of different brands. It is not difficult to imagine that if they are produced in different regions, varying consumer preferences would result in both regions exporting and importing hand soaps.
The role of cross-hauling in generating regional accounts is quite important, and few regionalization approaches account for it explicitly. The effect of greater levels of cross-hauling is a reduction in the regions industrial multipliers, because increasing shares of a region’s production are responding to export demand, and smaller shares of consumption dollars are remaining within the region.
When Allow Cross-hauling Editing is selected and the user clicks OK.
IO-Snap opens the Cross-hauling Estimates form.
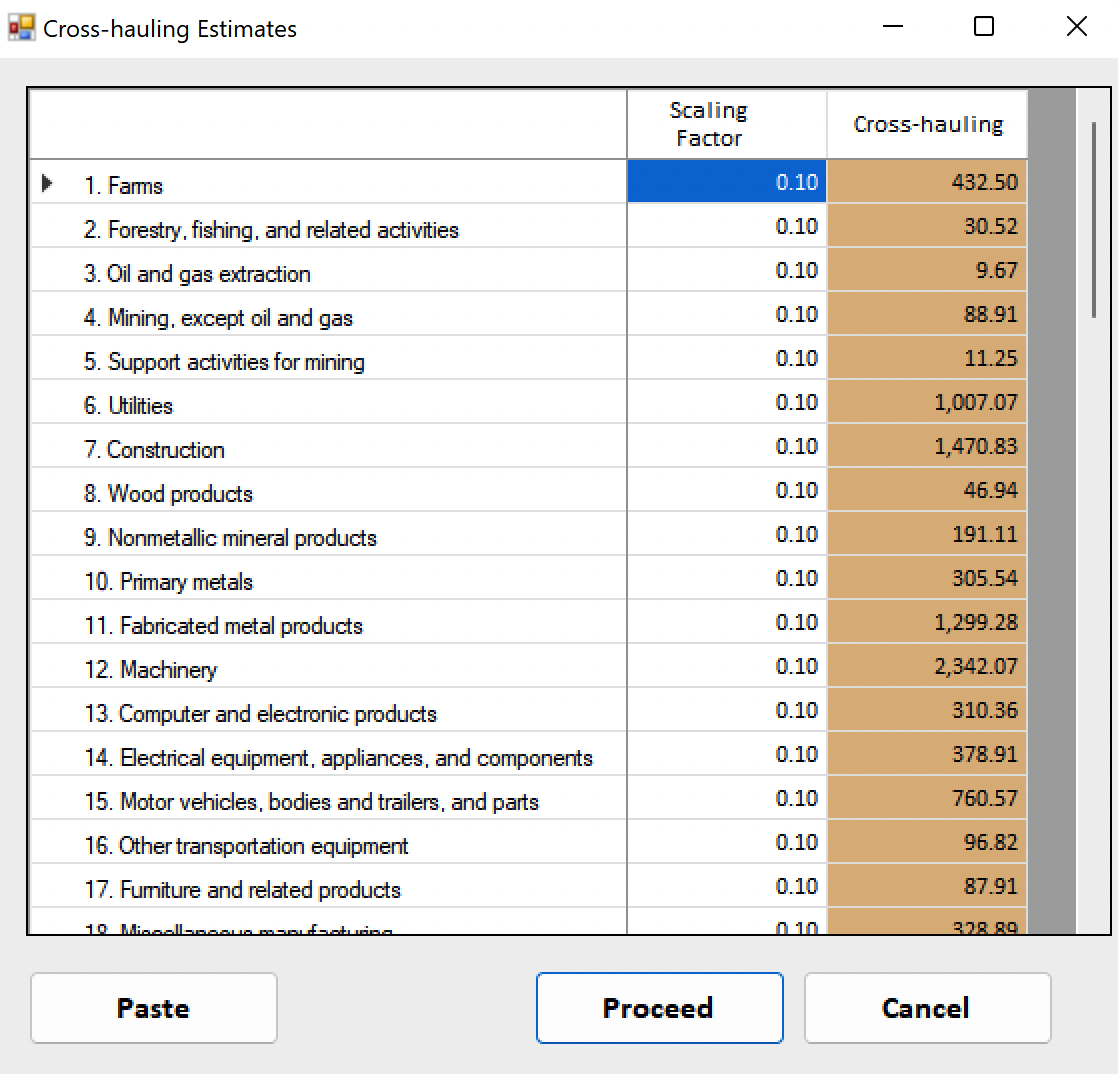
The first data column displays the default cross-hauling factor, as described in the IO-Snap Technical Documents. The second data column displays the cross-hauling estimate for each regional industry. Users can modify the cross-hauling estimates for each industry by changing its cross-hauling factor. Users also can change the default cross-hauling estimate in File > Preferences > Advanced.
